Matplot
Mon 30 June 2025
import matplotlib.pyplot as plt
x = [1, 2, 3, 4]
y = [10, 20, 25, 30]
plt.plot(x, y)
plt.title('Basic Line Plot')
plt.show()

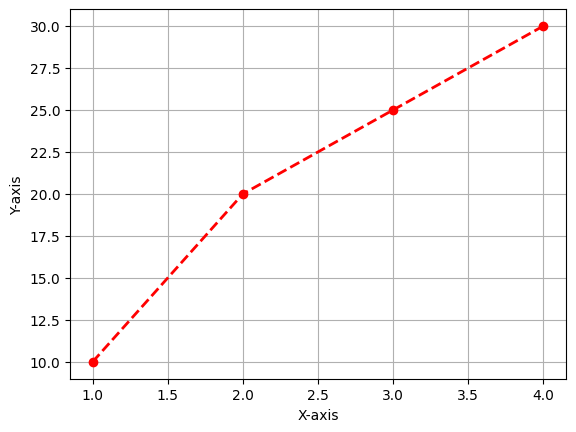
plt.plot(x, y, color='red', marker='o', linestyle='--', linewidth=2)
plt.grid(True)
plt.xlabel('X-axis')
plt.ylabel('Y-axis')
plt.show()
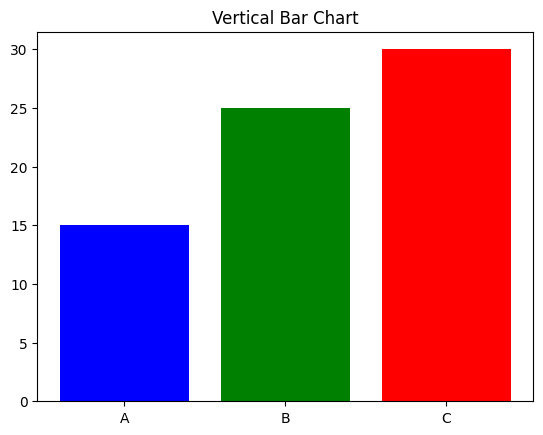
categories = ['A', 'B', 'C']
values = [15, 25, 30]
plt.bar(categories, values, color=['blue', 'green', 'red'])
plt.title('Vertical Bar Chart')
plt.show()
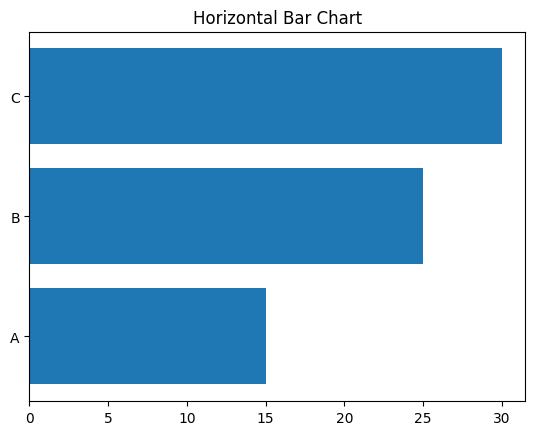
plt.barh(categories, values)
plt.title('Horizontal Bar Chart')
plt.show()
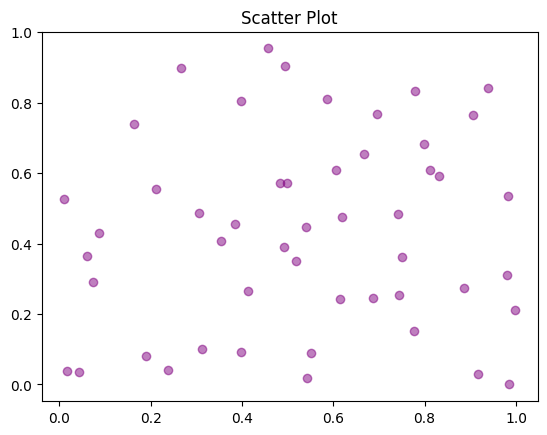
import numpy as np
x = np.random.rand(50)
y = np.random.rand(50)
plt.scatter(x, y, c='purple', alpha=0.5)
plt.title('Scatter Plot')
plt.show()
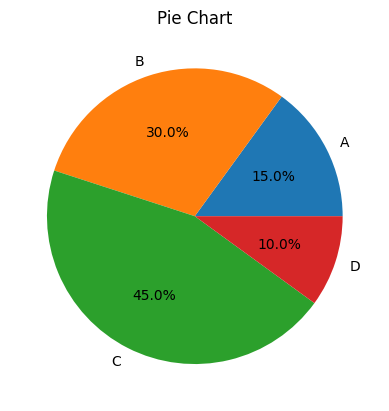
sizes = [15, 30, 45, 10]
labels = ['A', 'B', 'C', 'D']
plt.pie(sizes, labels=labels, autopct='%1.1f%%')
plt.title('Pie Chart')
plt.show()
data = np.random.normal(170, 10, 250)
plt.hist(data, bins=20, edgecolor='black')
plt.title('Histogram')
plt.show()

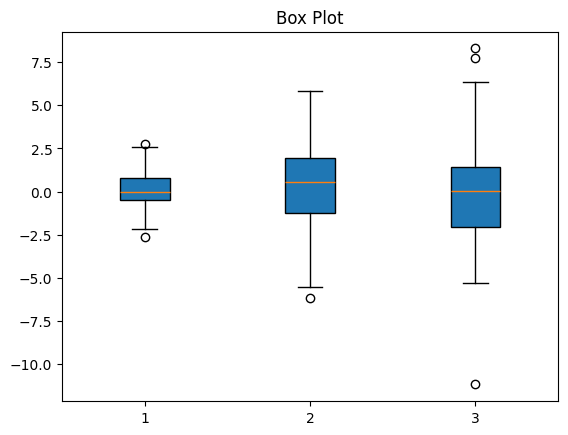
data = [np.random.normal(0, std, 100) for std in range(1, 4)]
plt.boxplot(data, vert=True, patch_artist=True)
plt.title('Box Plot')
plt.show()
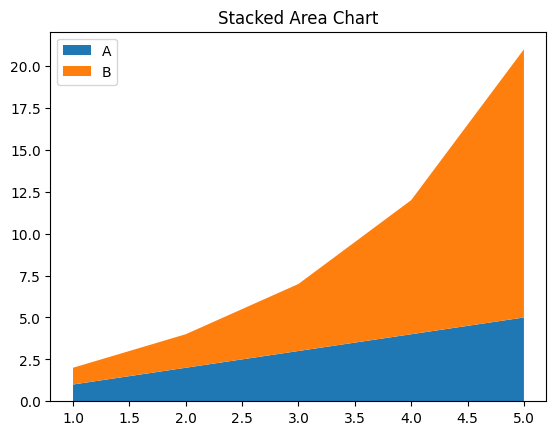
x = range(1, 6)
y1 = [1, 2, 3, 4, 5]
y2 = [1, 2, 4, 8, 16]
plt.stackplot(x, y1, y2, labels=['A', 'B'])
plt.legend(loc='upper left')
plt.title('Stacked Area Chart')
plt.show()
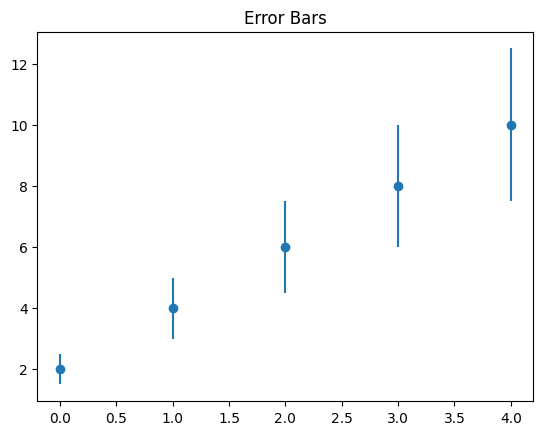
x = np.arange(5)
y = [2, 4, 6, 8, 10]
error = [0.5, 1, 1.5, 2, 2.5]
plt.errorbar(x, y, yerr=error, fmt='o')
plt.title('Error Bars')
plt.show()
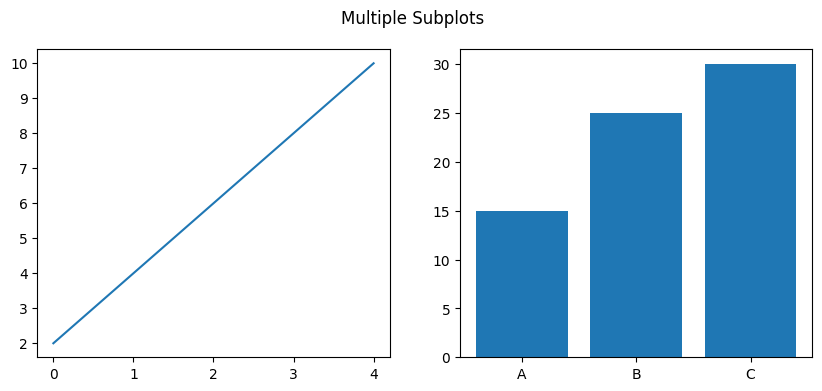
fig, (ax1, ax2) = plt.subplots(1, 2, figsize=(10,4))
ax1.plot(x, y)
ax2.bar(categories, values)
plt.suptitle('Multiple Subplots')
plt.show()
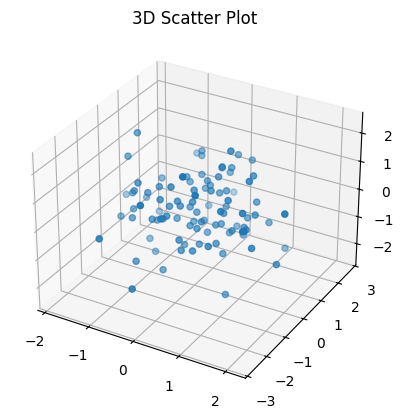
from mpl_toolkits.mplot3d import Axes3D
fig = plt.figure()
ax = fig.add_subplot(111, projection='3d')
x = np.random.standard_normal(100)
y = np.random.standard_normal(100)
z = np.random.standard_normal(100)
ax.scatter(x, y, z)
plt.title('3D Scatter Plot')
plt.show()
r = np.arange(0, 2, 0.01)
theta = 2 * np.pi * r
plt.polar(theta, r)
plt.title('Polar Plot')
plt.show()

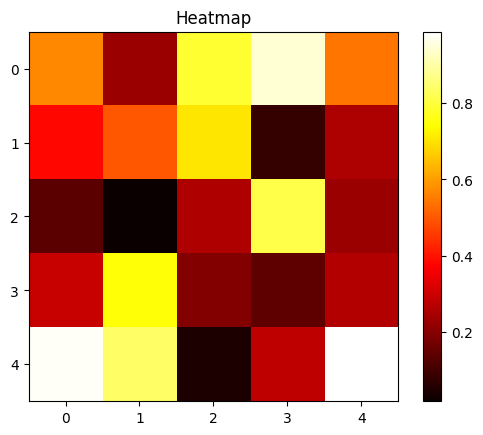
data = np.random.rand(5, 5)
plt.imshow(data, cmap='hot')
plt.colorbar()
plt.title('Heatmap')
plt.show()
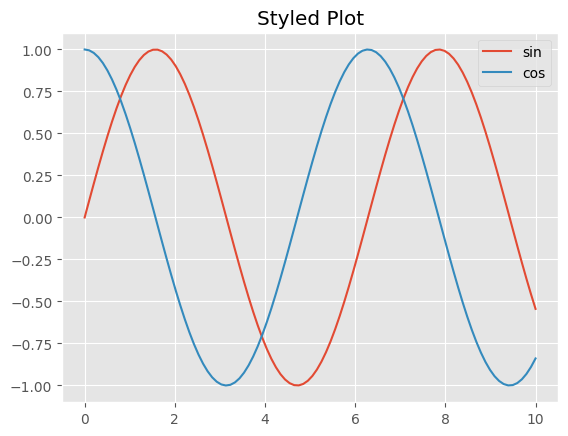
plt.style.use('ggplot')
x = np.linspace(0, 10, 100)
plt.plot(x, np.sin(x), label='sin')
plt.plot(x, np.cos(x), label='cos')
plt.legend()
plt.title('Styled Plot')
plt.show()
x = [1, 2, 3, 4]
y = [1, 4, 9, 16]
plt.plot(x, y)
plt.annotate('Important Point', xy=(3,9), xytext=(2,12),
             arrowprops=dict(facecolor='black', shrink=0.05))
plt.title('Plot with Annotation')
plt.show()

Score: 15
Category: basics