import matplotlib.pyplot as plt
movies = [
    {"title": "Inception", "rating": 8.8},
    {"title": "Interstellar", "rating": 8.6},
    {"title": "The Dark Knight", "rating": 9.0},
    {"title": "Tenet", "rating": 7.5},
    {"title": "Dunkirk", "rating": 7.9}
]
# Create DataFrame
import pandas as pd
df = pd.DataFrame(movies)
df
|
title |
rating |
| 0 |
Inception |
8.8 |
| 1 |
Interstellar |
8.6 |
| 2 |
The Dark Knight |
9.0 |
| 3 |
Tenet |
7.5 |
| 4 |
Dunkirk |
7.9 |
# Average rating
df["rating"].mean()
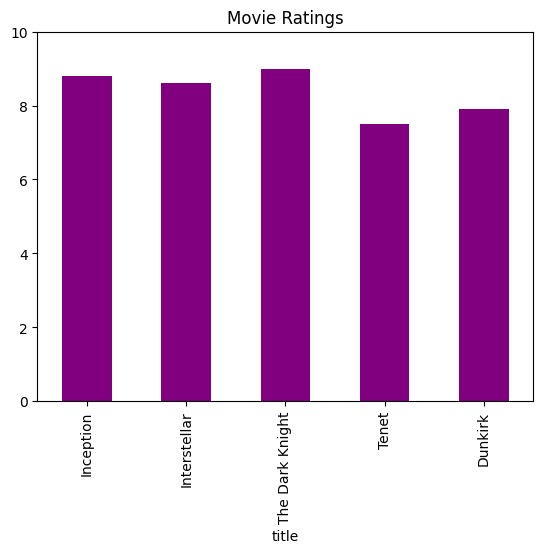
# Bar plot
df.plot.bar(x="title", y="rating", legend=False, color="purple")
plt.title("Movie Ratings")
plt.ylim(0, 10)
plt.show()
# High rated
df[df["rating"] >= 8.5]
|
title |
rating |
| 0 |
Inception |
8.8 |
| 1 |
Interstellar |
8.6 |
| 2 |
The Dark Knight |
9.0 |
# Sort by rating
df.sort_values(by="rating", ascending=False)
|
title |
rating |
| 2 |
The Dark Knight |
9.0 |
| 0 |
Inception |
8.8 |
| 1 |
Interstellar |
8.6 |
| 4 |
Dunkirk |
7.9 |
| 3 |
Tenet |
7.5 |
# Add genre
df["genre"] = ["Sci-Fi", "Sci-Fi", "Action", "Thriller", "War"]
df
|
title |
rating |
genre |
| 0 |
Inception |
8.8 |
Sci-Fi |
| 1 |
Interstellar |
8.6 |
Sci-Fi |
| 2 |
The Dark Knight |
9.0 |
Action |
| 3 |
Tenet |
7.5 |
Thriller |
| 4 |
Dunkirk |
7.9 |
War |
Score: 5