# 1. Import required libraries
import pandas as pd
import numpy as np
import matplotlib.pyplot as plt
# 2. Create a sample movie dataset
data = {
    "title": ["Inception", "Titanic", "Avengers", "Shrek", "Up", "Coco", "Joker", "Frozen", "Toy Story", "Tenet"],
    "genre": ["Sci-Fi", "Romance", "Action", "Animation", "Animation", "Animation", "Drama", "Animation", "Animation", "Sci-Fi"],
    "year": [2010, 1997, 2012, 2001, 2009, 2017, 2019, 2013, 1995, 2020],
    "rating": [8.8, 7.8, 8.1, 7.9, 8.3, 8.4, 8.5, 7.5, 8.3, 7.4],
    "votes": [2000000, 1100000, 1800000, 600000, 800000, 500000, 1000000, 700000, 900000, 400000]
}
# 3. Convert to DataFrame
df = pd.DataFrame(data)
df
|
title |
genre |
year |
rating |
votes |
| 0 |
Inception |
Sci-Fi |
2010 |
8.8 |
2000000 |
| 1 |
Titanic |
Romance |
1997 |
7.8 |
1100000 |
| 2 |
Avengers |
Action |
2012 |
8.1 |
1800000 |
| 3 |
Shrek |
Animation |
2001 |
7.9 |
600000 |
| 4 |
Up |
Animation |
2009 |
8.3 |
800000 |
| 5 |
Coco |
Animation |
2017 |
8.4 |
500000 |
| 6 |
Joker |
Drama |
2019 |
8.5 |
1000000 |
| 7 |
Frozen |
Animation |
2013 |
7.5 |
700000 |
| 8 |
Toy Story |
Animation |
1995 |
8.3 |
900000 |
| 9 |
Tenet |
Sci-Fi |
2020 |
7.4 |
400000 |
# 4. Check data types and info
df.info()
<class 'pandas.core.frame.DataFrame'>
RangeIndex: 10 entries, 0 to 9
Data columns (total 5 columns):
 #   Column  Non-Null Count  Dtype
---  ------  --------------  -----
 0   title   10 non-null     object
 1   genre   10 non-null     object
 2   year    10 non-null     int64
 3   rating  10 non-null     float64
 4   votes   10 non-null     int64
dtypes: float64(1), int64(2), object(2)
memory usage: 532.0+ bytes
# 5. Basic statistics
df.describe()
|
year |
rating |
votes |
| count |
10.00000 |
10.000000 |
1.000000e+01 |
| mean |
2009.30000 |
8.100000 |
9.800000e+05 |
| std |
8.90755 |
0.447214 |
5.329165e+05 |
| min |
1995.00000 |
7.400000 |
4.000000e+05 |
| 25% |
2003.00000 |
7.825000 |
6.250000e+05 |
| 50% |
2011.00000 |
8.200000 |
8.500000e+05 |
| 75% |
2016.00000 |
8.375000 |
1.075000e+06 |
| max |
2020.00000 |
8.800000 |
2.000000e+06 |
# 6. Add a column for rating category
def rate_group(r):
    if r >= 8.5:
        return "Excellent"
    elif r >= 8.0:
        return "Good"
    elif r >= 7.5:
        return "Average"
    else:
        return "Below Average"

df["rating_group"] = df["rating"].apply(rate_group)
# 7. Count of each rating group
df["rating_group"].value_counts()
rating_group
Good             4
Average          3
Excellent        2
Below Average    1
Name: count, dtype: int64
# 8. Count of each genre
df["genre"].value_counts()
genre
Animation    5
Sci-Fi       2
Romance      1
Action       1
Drama        1
Name: count, dtype: int64
# 9. Top rated movie
df[df["rating"] == df["rating"].max()]
|
title |
genre |
year |
rating |
votes |
rating_group |
| 0 |
Inception |
Sci-Fi |
2010 |
8.8 |
2000000 |
Excellent |
# 10. Lowest rated movie
df[df["rating"] == df["rating"].min()]
|
title |
genre |
year |
rating |
votes |
rating_group |
| 9 |
Tenet |
Sci-Fi |
2020 |
7.4 |
400000 |
Below Average |
# 11. Filter animation movies
df[df["genre"] == "Animation"]
|
title |
genre |
year |
rating |
votes |
rating_group |
| 3 |
Shrek |
Animation |
2001 |
7.9 |
600000 |
Average |
| 4 |
Up |
Animation |
2009 |
8.3 |
800000 |
Good |
| 5 |
Coco |
Animation |
2017 |
8.4 |
500000 |
Good |
| 7 |
Frozen |
Animation |
2013 |
7.5 |
700000 |
Average |
| 8 |
Toy Story |
Animation |
1995 |
8.3 |
900000 |
Good |
# 12. Movies released after 2010
df[df["year"] > 2010]
|
title |
genre |
year |
rating |
votes |
rating_group |
| 2 |
Avengers |
Action |
2012 |
8.1 |
1800000 |
Good |
| 5 |
Coco |
Animation |
2017 |
8.4 |
500000 |
Good |
| 6 |
Joker |
Drama |
2019 |
8.5 |
1000000 |
Excellent |
| 7 |
Frozen |
Animation |
2013 |
7.5 |
700000 |
Average |
| 9 |
Tenet |
Sci-Fi |
2020 |
7.4 |
400000 |
Below Average |
# 13. Group by genre and average rating
df.groupby("genre")["rating"].mean()
genre
Action       8.10
Animation    8.08
Drama        8.50
Romance      7.80
Sci-Fi       8.10
Name: rating, dtype: float64
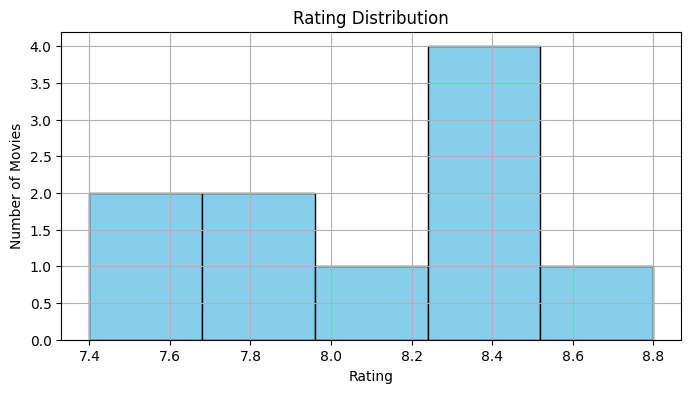
# 14. Visualization: Rating Distribution
plt.figure(figsize=(8, 4))
plt.hist(df["rating"], bins=5, color="skyblue", edgecolor="black")
plt.title("Rating Distribution")
plt.xlabel("Rating")
plt.ylabel("Number of Movies")
plt.grid(True)
plt.show()
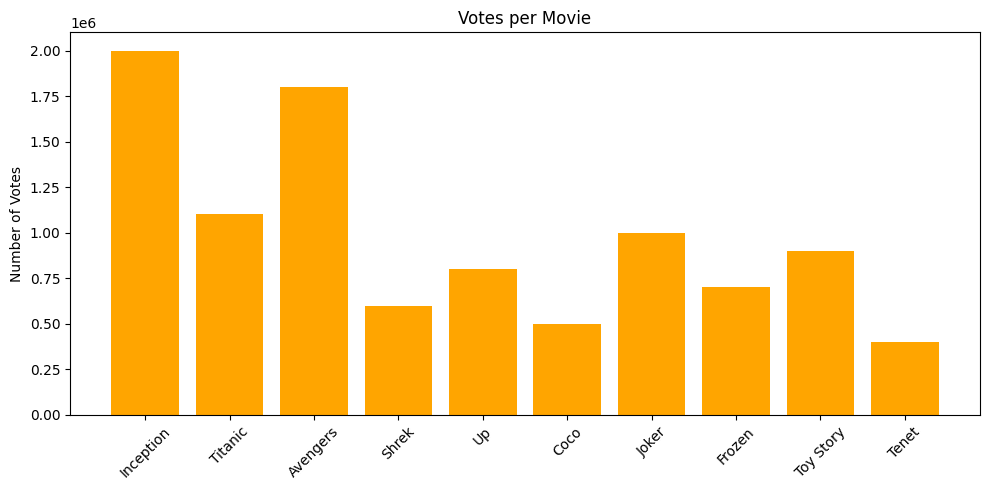
# 15. Bar chart: Votes per movie
plt.figure(figsize=(10, 5))
plt.bar(df["title"], df["votes"], color="orange")
plt.xticks(rotation=45)
plt.title("Votes per Movie")
plt.ylabel("Number of Votes")
plt.tight_layout()
plt.show()
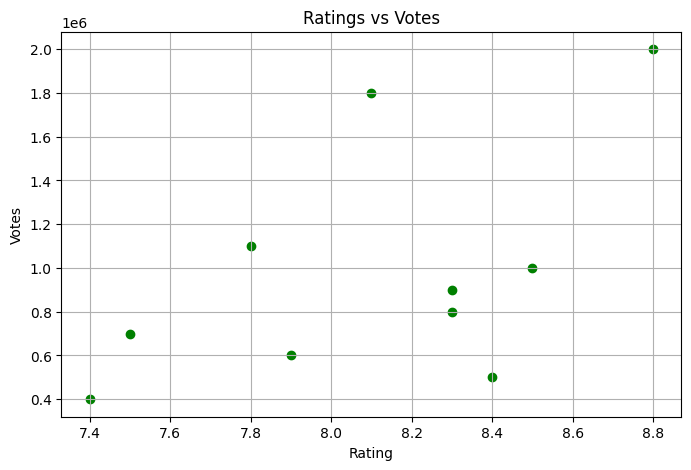
# 16. Scatter plot: Ratings vs Votes
plt.figure(figsize=(8, 5))
plt.scatter(df["rating"], df["votes"], color="green")
plt.title("Ratings vs Votes")
plt.xlabel("Rating")
plt.ylabel("Votes")
plt.grid(True)
plt.show()
Score: 15