Weather
Mon 30 June 2025
import numpy as np
import matplotlib.pyplot as plt
# Simulated temperature data for June
temps = np.random.normal(35, 5, 30)  # 30 days of June
temps
array([29.41326559, 34.80917293, 26.87578012, 26.85251075, 38.34895339,
       25.63473964, 39.60417612, 39.14748075, 44.21751801, 30.73423255,
       31.87543814, 38.50503022, 36.81997427, 35.8170198 , 39.15549537,
       30.83652052, 40.57593453, 35.93089267, 39.81302563, 28.98334882,
       38.84467163, 36.01008614, 37.81135308, 38.47389326, 37.31745099,
       34.5362433 , 37.568632  , 34.13176096, 38.65801923, 30.03139533])
# Basic stats
print("Mean:", np.mean(temps))
print("Max:", np.max(temps))
print("Min:", np.min(temps))
print("Std Dev:", np.std(temps))
Mean: 35.24446719110152
Max: 44.21751801492531
Min: 25.634739639235278
Std Dev: 4.622607972009356
# Days hotter than 40°C
temps[temps > 40]
array([44.21751801, 40.57593453])
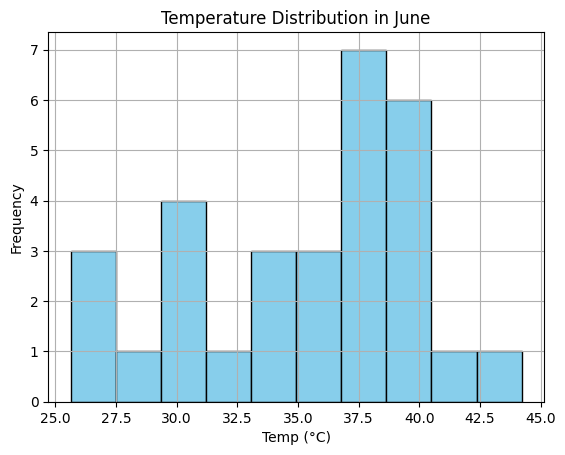
# Histogram
plt.hist(temps, bins=10, color='skyblue', edgecolor='black')
plt.title("Temperature Distribution in June")
plt.xlabel("Temp (°C)")
plt.ylabel("Frequency")
plt.grid(True)
plt.show()
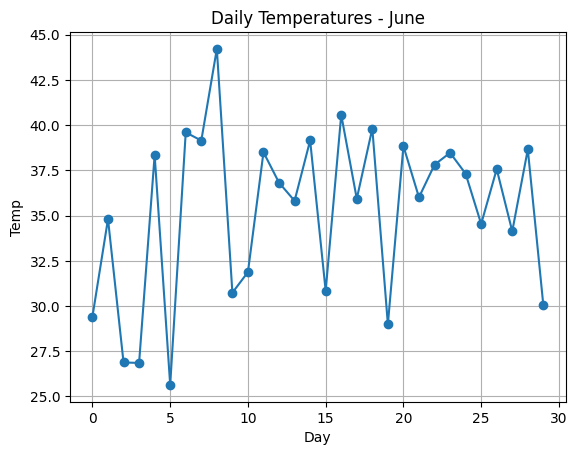
# Line plot
plt.plot(temps, marker="o")
plt.title("Daily Temperatures - June")
plt.xlabel("Day")
plt.ylabel("Temp")
plt.grid()
plt.show()
# Highlight heatwaves
heatwave = np.where(temps > 42)[0]
heatwave
array([8])
# Count cooler days (<30°C)
np.sum(temps < 30)
np.int64(5)
# Temperature range
np.ptp(temps)  # Peak-to-peak
np.float64(18.582778375690033)
# Sort
sorted_temps = np.sort(temps)
sorted_temps
array([25.63473964, 26.85251075, 26.87578012, 28.98334882, 29.41326559,
       30.03139533, 30.73423255, 30.83652052, 31.87543814, 34.13176096,
       34.5362433 , 34.80917293, 35.8170198 , 35.93089267, 36.01008614,
       36.81997427, 37.31745099, 37.568632  , 37.81135308, 38.34895339,
       38.47389326, 38.50503022, 38.65801923, 38.84467163, 39.14748075,
       39.15549537, 39.60417612, 39.81302563, 40.57593453, 44.21751801])
Score: 10
Category: basics